Trader Collectives Leverage Shared Toolkits to Unravel Exchange Market Dynamics
Xander Carter · Aug 5, 2026

Trader Collectives Leverage Shared Toolkits to Unravel Exchange Market Dynamics
Trading communities have developed structured approaches to analyzing betting exchange data through coordinated use of custom toolkits and centralized dashboards, and observers note that these systems allow participants to identify recurring market behaviors across various sports and events. Data compiled from multiple platforms shows increased activity in collective analysis methods during periods of high trading volume, including August 2026 when several major tournaments coincided with elevated liquidity on exchanges.
Formation of Trader Collectives
Individuals with experience in betting exchanges often form groups to pool resources for data collection and pattern identification, and researchers tracking these networks report that membership typically includes participants who contribute either coding expertise or access to historical datasets. These collectives establish protocols for data sharing that maintain anonymity while permitting real-time updates to common repositories, and studies from academic sources such as the UNSW Gambling Research Centre indicate measurable improvements in signal accuracy when multiple data streams undergo combined processing.
Groups coordinate through encrypted channels and version-controlled software repositories, yet they maintain separation between personal trading accounts to comply with platform rules. Documentation from industry associations reveals that such arrangements have expanded steadily since 2023, with participation rates rising in line with broader availability of application programming interfaces from exchange operators.
Shared Toolkits and Their Components
Toolkits assembled by these collectives generally contain modules for scraping market depth, calculating implied probabilities, and flagging deviations from historical norms, and developers within the groups update these components regularly to accommodate changes in exchange interfaces. Participants contribute code snippets that handle tasks such as automated scraping of order books and integration with external statistical libraries, while testing occurs through shared sandbox environments before deployment across the collective.
One documented approach involves modular scripts that parse live feed data into standardized formats, allowing dashboard visualizations to update without manual intervention. Evidence from technical forums associated with quantitative trading communities shows that toolkit reliability increases when contributors conduct peer reviews of new additions, reducing instances of parsing errors during peak trading hours.
Statistical Dashboards in Practice
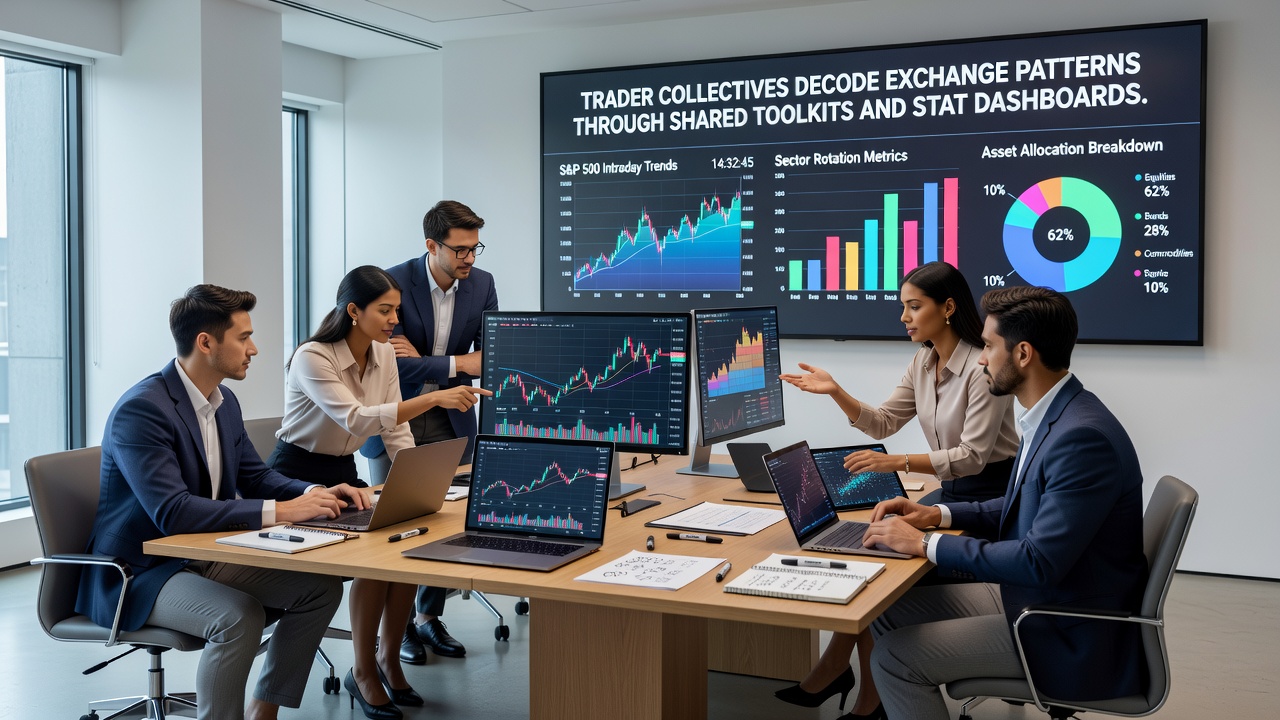
Dashboards serve as the central interface where processed data appears in graphical and tabular forms, and designers incorporate filters that isolate variables such as time of day, event type, and liquidity thresholds. Users configure alerts that trigger when specific pattern criteria match incoming data streams, and collective members report that synchronized dashboard views enable simultaneous review of multiple events without requiring constant verbal coordination.
Configuration files shared among participants standardize color coding and metric definitions, which minimizes misinterpretation during fast-moving markets. Figures from platform analytics providers indicate that sessions involving dashboard collaboration often extend longer than individual trading periods, particularly when covering overlapping fixtures in cricket or soccer leagues.
Pattern Decoding Through Collective Analysis
Pattern recognition emerges when aggregated historical records undergo comparison against live conditions, and analysts within collectives apply regression models alongside simpler threshold-based rules to highlight potential market movements. Data sets compiled over multiple seasons allow identification of recurring anomalies around specific score thresholds or time intervals, and these observations undergo validation through backtesting against archived exchange records before wider dissemination within the group.
During August 2026, increased fixture density across several sports coincided with documented spikes in dashboard usage, according to aggregated usage metrics released by software hosting services. Collectives documented shifts in market depth patterns that aligned with previous instances of late-match volatility, and participants adjusted position sizing parameters accordingly based on toolkit outputs.
Integration with External Data Sources
Groups supplement exchange feeds with weather data, injury reports, and venue statistics drawn from public records, and these inputs feed into custom scoring systems that rank event likelihoods. Integration occurs through scheduled API calls that refresh at intervals matching the pace of each sport, and dashboard layers display composite scores alongside raw market prices for direct comparison.
Regulatory filings from bodies such as teh National Council on Problem Gambling note rising interest in transparent data practices among organized trading groups, though specific operational details remain internal to each collective. Cross-referencing of multiple information streams reduces reliance on any single source and supports more consistent identification of statistical edges.
Conclusion
Trader collectives continue to refine shared toolkits and dashboard systems as exchange markets evolve, and available records show sustained adoption of these collaborative methods across different regions and event types. The combination of standardized data processing and visual analysis tools provides participants with structured ways to monitor patterns without requiring each individual to maintain separate infrastructure. Ongoing development within these networks focuses on automation of routine tasks and expansion of historical datasets to cover additional sports and time zones.